- Overview of the dataset
- Data Preparation
- Data Analysis
- Data visualization
- A full review of the dashboard
- Key Insights
- Improvement approaches
With the rapid innovation of technology, more innovative, more strategic, and data-supported talent decisions are within reach. HR analytics is a deep data-driven and goal-focused study of all human processes, functions, challenges and opportunities at work to improve those systems and achieve sustainable business success. This applies across the entire employee lifecycle — from making better hiring decisions to more effective performance management to better employee retention.

This case study will serve as an example of how gathering and evaluating human capital analytics can lead to better decision-making through the application of statistics and other data interpretation techniques. In the case study, the tool PowerBI will be utilized After a quick view of the data, the data will be imported into Power BI. In Power BI, the data will be organized with DAX functions and visualized in the dashboard with the help of the function “Build Visual”
The inspiration is coming from the Youtube channel Data with Decisionand the accesss to the dataset can also be founded there.
Overview of the dataset
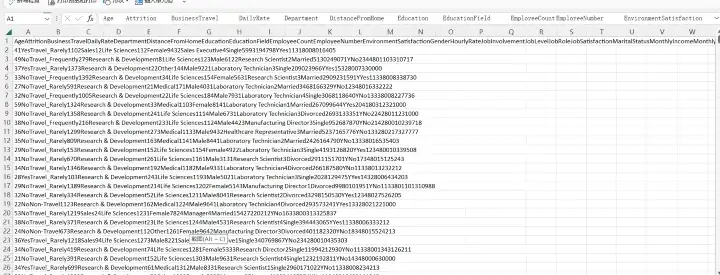
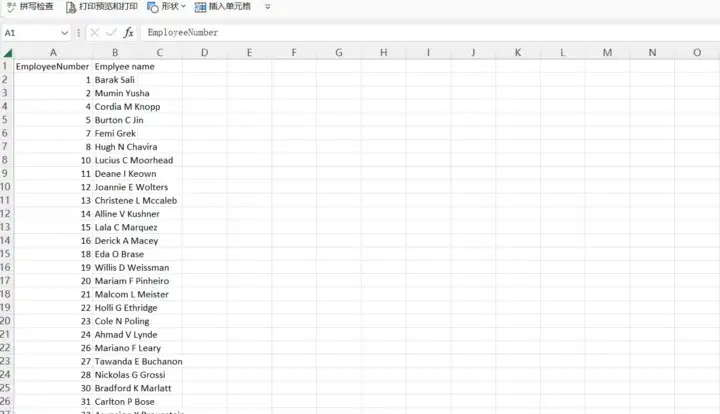
The dataset of the case study is made up of two files. A quick view to see file type (CSV file), what types of data they consist of, the number of rows and columns, and if there is any “null” value…
Data Preparation
The data will now be imported into Power BI through the “Get Data” function in Home. It is worth attention to import data with a suitable mean of data sources. In this case, it would be “text/CSV”

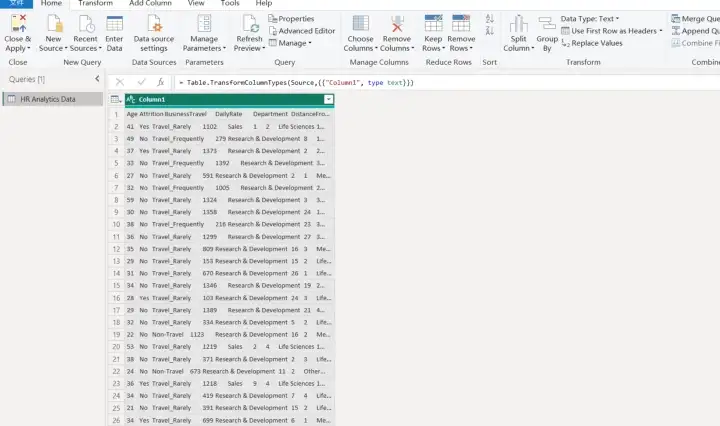
The data in the first file seems to be a bit messy, but the cleanup will be done directly in Power Query Editor. Under the home section, use the button “split column” and split the column by delimiter.


The data now looks well-organized However, the headers do not make any sense. Moving the first row as headers will become the next step that can be realized with the click to “Use First Row as Headers” in the “transform” section.


After uploading the second file with a similar process, the dataset has been created and is ready for further analysis.
Data Analysis
Generating insights requires more than just generating PivotTables or PivotCharts from existing data. In this case, critical data needs to be analyzed across multiple data categories, and for different ranges. DAX is a collection of functions, operators, and constants that can be used in a formula or expression to calculate and return one or more values that will be used in this phrase. Some of the measures are created and will be shown below. Basic information calculation (COUNTROWS, CALCULATE, DIVIDE)
# total employees, number of workers by gender, gender ratio, employee rating, current active workers
Total Emp = COUNTROWS('HR Analytics Data')
Female = CALCULATE([Total Emp],'HR Analytics Data'[Gender]="female")
Female % = DIVIDE([Female],[Total Emp],0)
High emp rating = CALCULATE([Total Emp],'HR Analytics Data'[Performance Rating]="High ratings")
Active workers = CALCULATE([Total Emp],'HR Analytics Data'[Retirement]="on service")
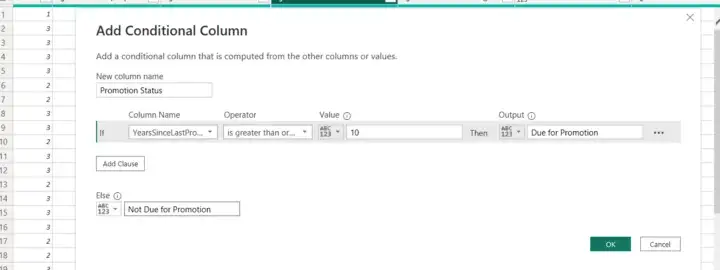
Advanced calculation(ISBLANK, IF) To operate the advanced calculation, it is important to first create a new column to show who should be promoted or not. Conditional formatting will be used here. Employees who have not been promoted last ten years or above can be potentially seen as”due promotion”.
# number of employees due for promotion
Due for promotion = IF(ISBLANK(CALCULATE([Total Emp],'HR Analytics Data'[Promotion status]="due for promotion")),0,CALCULATE([Total Emp],'HR Analytics Data'[Promotion status]="due for promotion"))
# Use the above conditional formatting again to see the number of employees due for retirement
Due for retirement = IF(ISBLANK( CALCULATE([Total Emp],'HR Analytics Data'[Retirement]="due for retirement")),0, CALCULATE([Total Emp],'HR Analytics Data'[Retirement]="due for retirement"))
# number of employees on services
On service = IF(ISBLANK( CALCULATE([Total Emp],'HR Analytics Data'[Retirement status]="on service")),0, CALCULATE([Total Emp],'HR Analytics Data'[Retirement]="on service"))
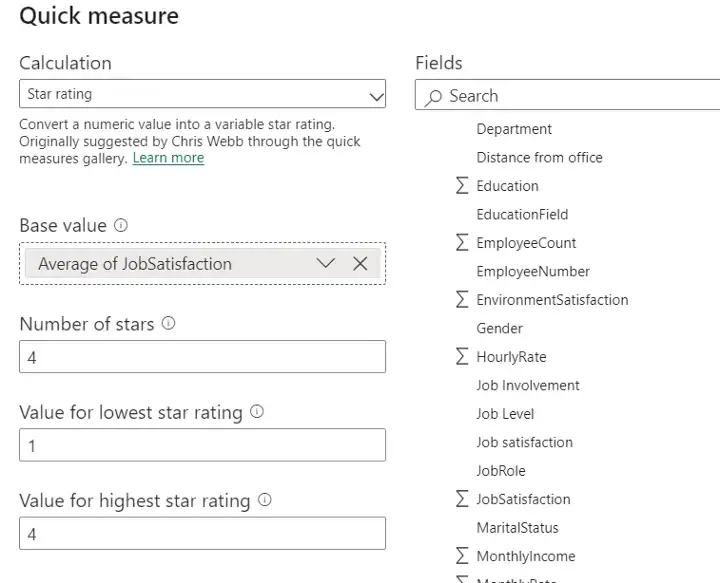
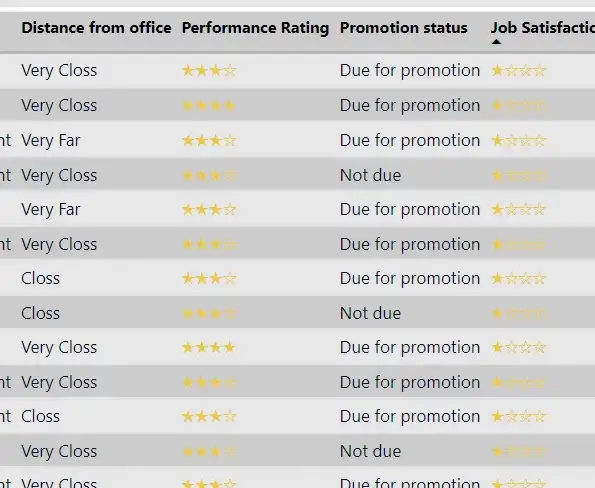
Quick Measure (star rating) To better visualize the data in the next step, the function of”quick measure” could be applied to use stars to show the rating of employees’ job satisfaction.
Data visualization
Before generating charts and tables to visualize data, it is essential to create a canvas first to ensure the dashboard is structured further.

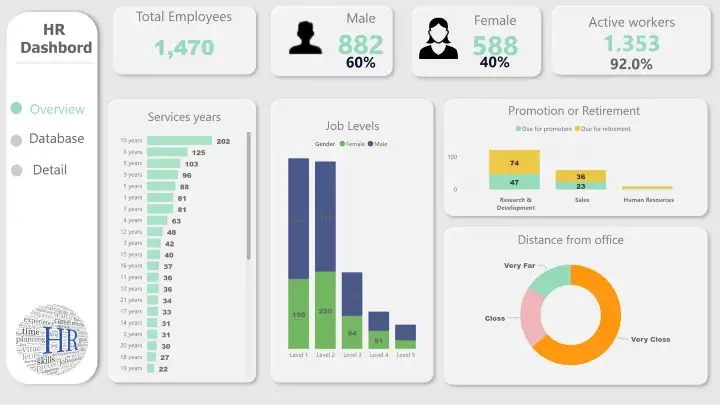
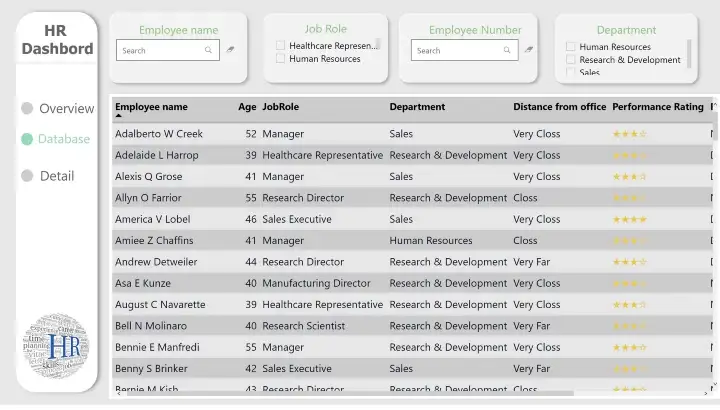
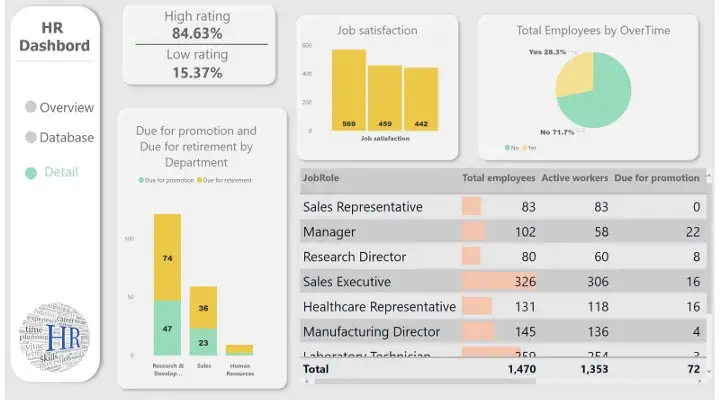
Afterwards, work becomes more accessible with the help of”the “build visual” function. For example, Cards are used to highlight general information, Donut charts to show the percentage of different categories, stacked column charts to compare different levels, stacked bar charts to mark descending or ascending order, and combining tables and filters to manage employees’ information and their KPIs.


A full review of the dashboard
Key Insights
Overall, the company has a higher employee job satisfaction rating. However, there is still improvement in promoting gender equity in the company especially considering the gender ratio and the situation that masculinity takes over corporate leadership positions. Also, the arrangement of promotion should be reconsidered while viewing the corresponding unequal working years and different departments.
Improvement approaches
- Establish a comprehensive promotion plan with the participation of employee representatives from all departments and ensure the transparency of the plan.
- Provide more room for promotion and more management seats for female employees. During the recruitment process, focus on finding more potential female candidates.
- Provide subsidies to employees who are far away from the company to further improve employee satisfaction.
- Set up the company’s talent training plan to coping with subsequent retirements of current job positions.
That’s the end of the case study, thank you for reading.
References
Data with decision. (n.d.). Data with decision. YouTube. https://www.youtube.com/@datalab365
Vulpen, E. van. (2021). What is HR analytics? AIHR. from https://www.aihr.com/blog/what-is-hr-analytics/
Minewiskan. (n.d.). Dax Function Reference https://learn.microsoft.com/en-us/dax/dax-function-reference
